 Apprenticeships
 Construction
 Education Tech
 Engineering
 Franchise Networks
 Legal Firms
 Logistics
 MATs
MATs Recruitment
 Retail
 Seasonal Staff
FrogLMS Community
Analytics
The aim of this site is to introduce Admins to the use of Analytics in FrogLMS. The Analytics area of the Frog platform captures information related to the use of the platform by end users covering areas such as user logins, site creation etc.
- Analytics Overview – Introduce using Analytics
- Analytics - Dashboard – Guidance on the Dashboard category
- Analytics - Sites – Guidance on the Sites category
- Analytics - User Logins – Guidance on the User category

Analytics: Dashboard
The initial Dashboard view shows the number of user logins per day, the number of site visits and a summary of Assignments. You can filter this information by profiles and you can choose whether to display the last 7 days or the last 30 days of information.
The Analytics area of the Frog platform captures information related to the use of the platform by end users covering areas such as user logins, site creation and assignments
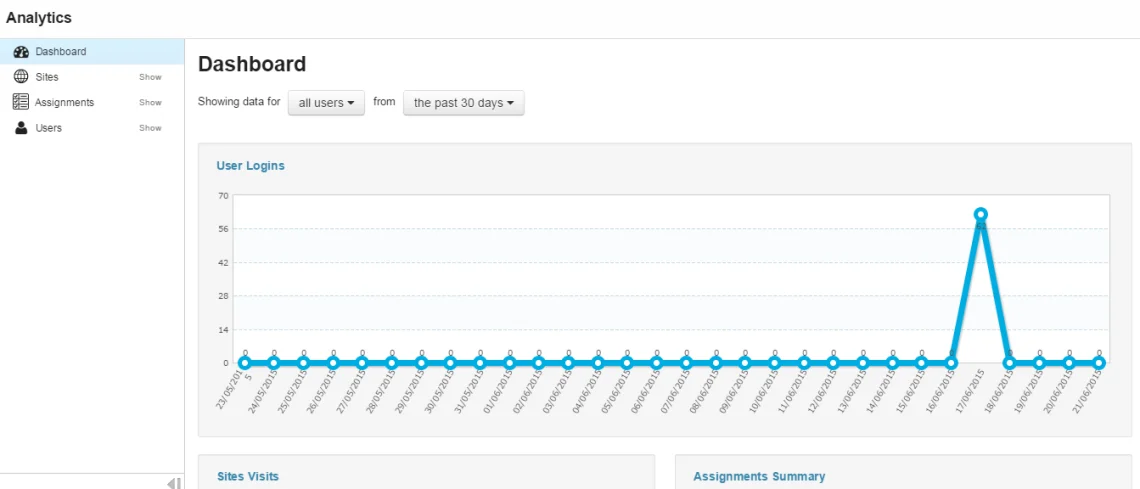
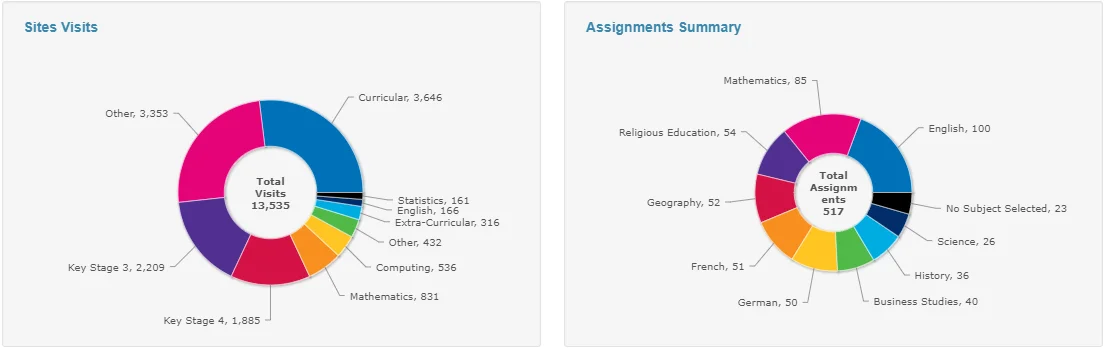
Below the user login information, you can see an overview of site visits and Assignments summary.
Analytics: Sites
The Sites category provides more detailed analytics covering the usage and creation of sites.
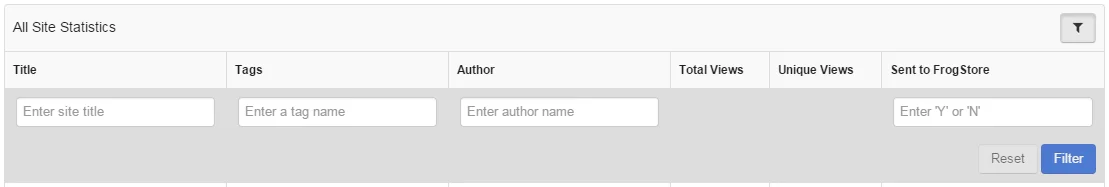
All Sites
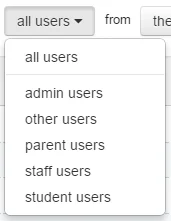
The All Sites view can be further filtered using the User Type drop down menu and the Date Range drop down menu.
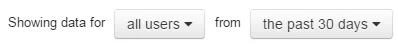
User type can be filtered by profile.
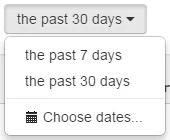
The date range for results can be set to the past 7 days, the past 30 days or a custom date range, selected using the Choose dates option.
A tabular version of the data displayed in the chart can be found below the chart itself. This tabular data can be filtered using the Filter button in the top right hand corner.
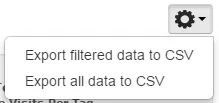
To export the data from the Analytics app, select the Action Menu and choose whether you wish to download all the data or your filtered view.
Sites by Tag
The Sites by Tag view allows you to see the number of sites, authors and views for a given tag within Frog Learn. This view might be helpful in identifying the key users of the platform as well as seeing areas that may not be creating sites.
Sites by Author
The Sites by Author view allows you to see the numbers of sites, tags used and view numbers for sites created by a specific author.
Analytics: User Logins
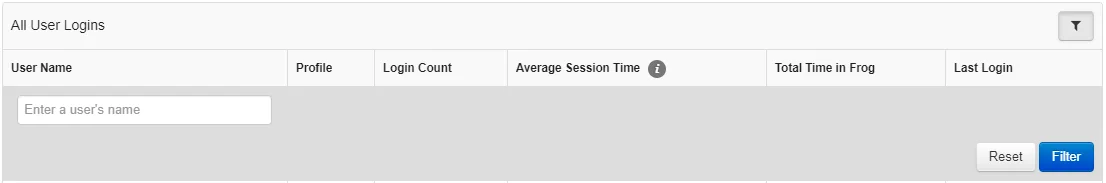
All Logins
The All Logins view shows global information on the users that are logging into the platform. Information includes the number of logins, average session times and the total time they have spent logged in. You can also see the date and time of their last login.
You can filter the view further using the User Type drop down menu and the Date Range drop down menu.

User type can be filtered by the admin of staff profiles.

The date range for results can be set to the past 7 days, the past 30 days or a custom date range, selected using the Choose dates option.

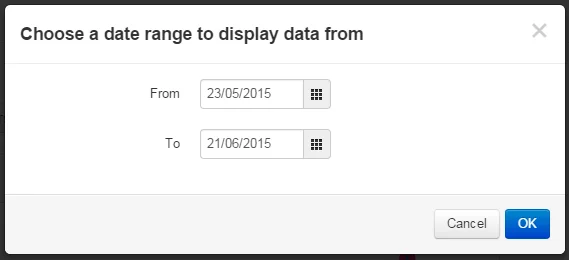
To choose a custom date range, select the Choose dates option followed by selecting a From and To date.


Logins by Profile
The Logins by Profile view allows you to further filter the information surrounding Logins to the platform by user's profiles, displaying information collated by these profiles.